Analysis of Productivity Growth in the United Kingdom
1. Introduction
The scope of this paper is to give a broad perspective of the return derived from industrial and commercial productivity in the United Kingdom. A productivity trend is identified in this paper and the sustainability of this trend is assessed. The productivity of the United Kingdom is also compared with that of the United States in order to derive country specific factors. Finally, attention is given to key implications that the factors identified hold to investors and senior managers.
2. Returns Derived from Productivity
Industrial and commercial productivity can provide macro- and micro-returns. Macro-returns are the returns that a whole country or community can derive. A key return generated from productivity is that the country can be more competitive than other countries on particular goods or services (Carayannis and Grigoroudis, 2014). This stimulates foreign entities to invest in this country and also increases the ability of the country to export goods and services that it is productive in. The second return derived from higher industrial and commercial productivity is linked to the increase in the gross domestic product. Gross domestic product can increase due to a number of factors, such as new technology or more government spending (Williamson, 2014). Hariri (2017) posits that productivity growth also provides stronger growth in the gross domestic product. Gross domestic product can be defined as the quantity of goods and services created in a country during a specified time frame (Williamson, 2014). When the gross domestic product increases it leads to economic growth. Economic growth helps to decrease the rate of unemployment and increase disposable income. Higher disposable income positively affects the standard of living of the people because they can start buying more luxury products (Cartwright, 2011). Moreover, it increases the revenue that can be generated by organisations providing luxury goods and services. Harari (2017, p. 3) supports the above claim by stating that productivity is directly related to standard of living and the ability of a country to enhance its standard of living during the years is “entirely dependent on productivity growth”. However, higher disposable income, which leads to better standard of living will have a negative impact on companies that produce inferior products because customers will start preferring to acquire luxury substitute goods and services.
Micro-returns reflect benefits that organisations can derive from better productivity. Horngren et al. (2015) posit that productivity helps the organisation to improve its profitability. This arises because an increase in productivity reflects more units produced from the resources inputted in the production process. Thus, this aids in decreasing the total cost per unit produced (Atrill and McLaney, 2009). Better profitability is also beneficial for investors because it increases the ability of the firm to pay dividends (McLaney, 2014). Moreover, it decreases the risk that the company becomes insolvent. Thus, it helps to decrease the investment risk of ordinary shareholders.
3. Sustainability of Productivity Trends in the United Kingdom
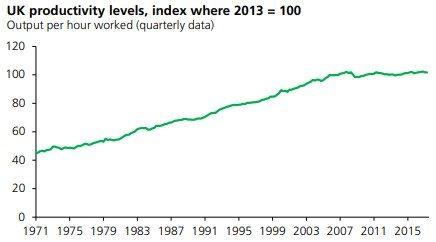
The productivity level in the United Kingdom has increased significantly from 1971 to 2007 (Harari, 2017). It has decreased during the financial crisis and stagnated after the financial crisis.

Source: Harari, 2017, p. 5
Figure 1 shows that there was a rising trend from 1971 to 2007. During the financial crisis (2008 and 2009) the productivity level decreased by 0.9% and 1.6% (Harari, 2017). In 2010 and 2011 there were signs of recovery as indicated by the percentage growth of 1.6% and 0.9%. However, in 2012 and 2013 there was another decrease of 0.9% and 0.4% (Harari, 2017). There was again recovery in 2014 and 2015 (0.6% and 0.9%) but in the third and fourth quarter of 2016 there was a decrease of 0.1% in both quarters (Harari, 2017). Jackson (2018, p. 1) contends that the United Kingdom has “experienced a lost decade of productivity growth”. This is due to the fact that the increase in the labour productivity in the United Kingdom over the last decade is the worst in comparison to previous periods since the 1820s and productivity level is barely above that prior to the financial crisis (Jackson, 2018). Therefore, there is stagnation in productivity level. Harari (2017) outlines a number of reasons that led to productivity stagnation in the United Kingdom. For example, an ageing population, the banking crisis led to lower lending to productive organisations, and lower productivity in the oil and gas industry and financial services industry (Harari, 2017).
Brexit is regarded as a key challenge to the productivity in the United Kingdom (Murphy and Glennon, 2016). Membership with the European Union facilities United Kingdom exports, which amount to around 45% (OECD, 2017). One of the key consequences of Brexit is that it influences the investment decisions of organisations. A survey performed by the Confederation of British Industry shows that 40% of the 357 organisations researched are influenced by Brexit (Colson, 2017). 98% of these respondents said that Brexit is negatively affecting their investment decisions. Thus, there is the risk that organisations may go out of the United Kingdom and start residing in other countries members of the European Union in order to continue benefitting from the free market. Brexit can also decrease foreign investment, which aids in the introduction of new technologies (Harari, 2017). Foreign investment and new technologies influence the industrial and commercial productivity. Moreover, access to large markets permits local organisations to “specialise and expand”, which aids in the attainment of economies of scale (Harari, 2017, p. 16). Economies of scale take place when a rise in output (productivity) is higher than the increase in input (Samuelson and Marks, 2012). Therefore, Brexit significantly challenges the ability of the United Kingdom government to maintain growth in the productivity level in the country. The key factor to the sustainability of this trend is that the United Kingdom government negotiates appropriate new trading agreements with countries members of the European Union. This would stimulate organisations to remain in the United Kingdom, attract foreign investment and facilitate specialisation of local firms.

Source: Harari, 2017, p. 7
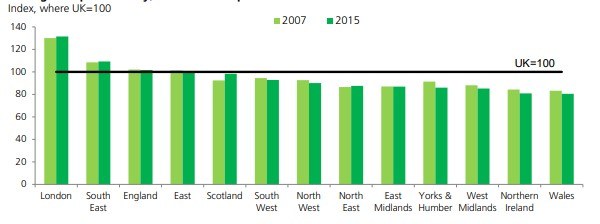
Figure 2 indicates the regional productivity in the United Kingdom. The most productive areas, which are exceeding the average productivity level of 2007 and 2015 are London and the South East region. Thus, these regions are providing the highest productivity returns, which were noted in the previous section. England and the East region meet the average productivity level. However, the other regions especially Wales and Northern Ireland are substantially below the average productivity level of 2007 and 2015. Therefore, these regions are the key problems that are limiting productivity growth in the United Kingdom.
4. Comparison to Productivity in the United States
The trend in productivity level in the United States is outlined in this section. Such trend will be compared with that of the United Kingdom in order to identify similarities and differences between the two countries.

Source: Sprague, 2017, p. 5
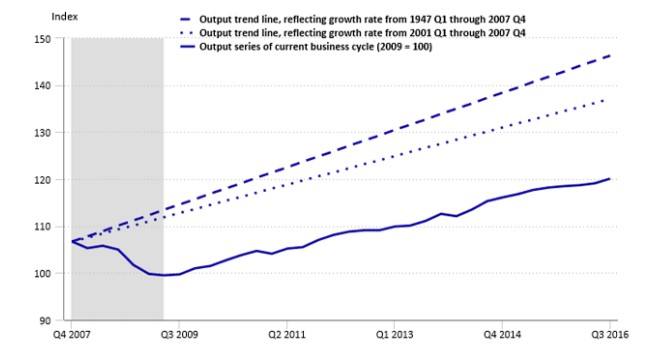
Figure 3 portrays the productivity output from the financial crisis to the third quarter of 2016. Productivity in the United States decreased from 2007 to 2009. This is similar to what happened in the United Kingdom. The financial crisis led to a high rate of unemployment, which subdued productivity in the country. Productivity growth in the United States started increasing after the third quarter of 2009, as shown in Figure 3. However, productivity growth after the financial crisis has not increased above 3.2% in any year (Sprague, 2017). This implies that the productivity in the United States was unable to “climb back to pre-recessionary trends” (Sprague, 2017, p. 5). The United Kingdom also faced stagnation after the financial crisis, as already stated above. Therefore, the trend in productivity output in the United States at the commencement of the financial crisis till the third quarter of 2016 is similar to that of the United Kingdom.
Harari (2017, p. 12) posits that “an ageing population” is one of the factors that led to stagnation in productivity in the United Kingdom. Jacobsen et al. (2011) posit that there is also the issue of a growing ageing population in the United States. Therefore, an ageing population is a common country specific factor that is leading to such a trend in productivity.
Harari (2017) contends that stagnation in productivity in the United Kingdom also emerged due to a decrease in bank lending provided to productive organisations. Kwan (2010) researched the impact of the financial crisis on bank lending in the United States. This scholar found that bank lending was tightened by large and medium-sized banks in the United States. Small banks operating in the United States also tightened bank lending but to a lower extent (Kwan, 2010).
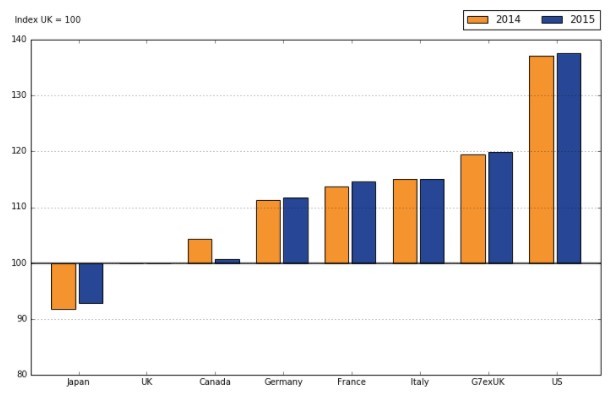
Despite these similarities it is important to remark that the productivity level of the United Kingdom is significantly lower than that of the United States.

Source: Office for National Statistics, 2015, p. 1.
The productivity in the United Kingdom, which is marked with an index of 100 is substantially lower than the United States. Indeed, the United States is the country that was able to generate the highest productivity level in comparison to Japan, the United Kingdom, Canada, Germany, France, Italy and the G7 excluding the United Kingdom. Tetlow (2018, p. 1) argues that the United Kingdom holds such a low level of productivity, which is also deteriorating because in the last five years employees have shifted to “less efficient industries”. Tetlow (2018) contends that more British employees are working in inefficient industries, such as health and hospitality. Furthermore, there was a decline in the number of workers employed in productive industries like mining and aviation. Inman (2016) identified two other factors that limit industrial and commercial productivity in the United Kingdom in comparison to other countries like the United States and Germany. The first factor is limited research and development. Research and development is considered a key factor that can help in the attainment of technology advancements. Technology is a key factor that stimulates productivity, as already stated above. The second factor identified by Inman (2016) is low skills training in comparison to other countries. Konings and Vanormelingen (2010) conducted an empirical study with the aim of investigating the influence of training on marginal productivity. These scholars researched 17,000 organisations and examined employees who took training between 1997 and 2006. The results of this research indicate that marginal productivity of employees increased after training was provided (Konings and Vanormelingen, 2010). Thus, this supports the claim of Inman (2016) that the lower staff training provided in the United Kingdom is negatively affecting productivity growth of this country in comparison to the United States.
5. Key Implications for Investors and Senior Managers
There was stagnation in productivity growth in the United Kingdom after the financial crisis. Ideally there should be productivity growth in industries and organisations located in the United Kingdom. Productivity growth is desirable for investors and senior managers because it leads to a more prosperous economy and enhances the profitability of business enterprises. The United Kingdom is in a worse situation than stagnation because Brexit is challenging such a trend and there is a high risk that productivity decreases in the future. Lower productivity would raise concerns among senior managers because the financial performance of the organisation would deteriorate. Senior managers are the individuals accountable to ordinary shareholders (Kieso et al., 2012). Thus, they may be held responsible for keeping the organisation in the United Kingdom and not transferring it to another country that is a member of the European Union. Deterioration in financial performance would also hold serious implications about the return that investors can get and on the investment risk. This may stimulate investors to sell ordinary shares in companies domiciled in the United Kingdom and acquire shares in companies located in other countries. Therefore, it is imperative that the United Kingdom government adopts measures to decrease the doubts concerning Brexit that productivity level will deteriorate due to trade barriers and other issues noted in section 3.
References
- Atrill, P. and McLaney, E. (2009) Management Accounting for Decision Makers. 6th ed. London: Prentice Hall.
- Carayannis, E. and Grigoroudis, E. (2014) ‘Linking innovation, productivity and competitiveness: Implications for policy and practice.’ The Journal of Technology Transfer, 39(2), 199-218.
- Cartwright, E. (2011) Behavioural Economics. London: Routledge.
- Colson, T. (2017) ‘Brexit is now directly damaging business investment in Britain,’ Business Insider [Online]. Available at: http://uk.businessinsider.com/cbi-brexit-is-directly-damaging-uk-business-investment-2017-7 [Accessed 8 February 2018].
- Harari, D. (2017) ‘Productivity in the UK,’ Parliament UK [Online]. Available at: http://webcache.googleusercontent.com/search?q=cache:0TxDfZulDiQJ:researchbriefings.files.parliament.uk/documents/SN06492/SN06492.pdf+&cd=1&hl=en&ct=clnk&gl=mt [Accessed 8 February 2018].
- Horngren, T. C., Datar, M. S. and Rajan, V. M. (2015) Cost Accounting: A Managerial Emphasis. 5th ed. London: Pearson.
- Inman, P. (2016) ‘Why is the UK’s productivity still behind that of other major economies?’, The Guardian [Online]. Available at: https://www.theguardian.com/business/2016/nov/24/why-is-uks-productivity-still-behind-that-of-other-major-economies [Accessed 8 February 2018].
- Jackson, G. (2018) ‘UK productivity grows at quickest pace in six years,’ Financial Times [Online]. Available at: https://www.ft.com/content/edcb9224-f1ff-11e7-b220-857e26d1aca4 [Accessed 8 February 2018].
- Jacobsen, A. L., Kent, M., Lee, M. and Mather, M. (2011) ‘America’s aging population.’ Population Bulletin, 66(1), 1-18.
Use the following coupon code :
NRSCODE

